
As the fall continues for crypto currencies, Bitcoin (BTC) and Ether (ETH) are testing important supports again. What are the different scenarios to look forward to in the coming days
Bitcoin (BTC) loses $50,000 support
After several weeks of decline, the price of Bitcoin (BTC) lost its psychological support of $50,000 yesterday against the backdrop of Evergrande’s bankruptcy, dragging altcoins in its fall. What impact could this have on what happens next?
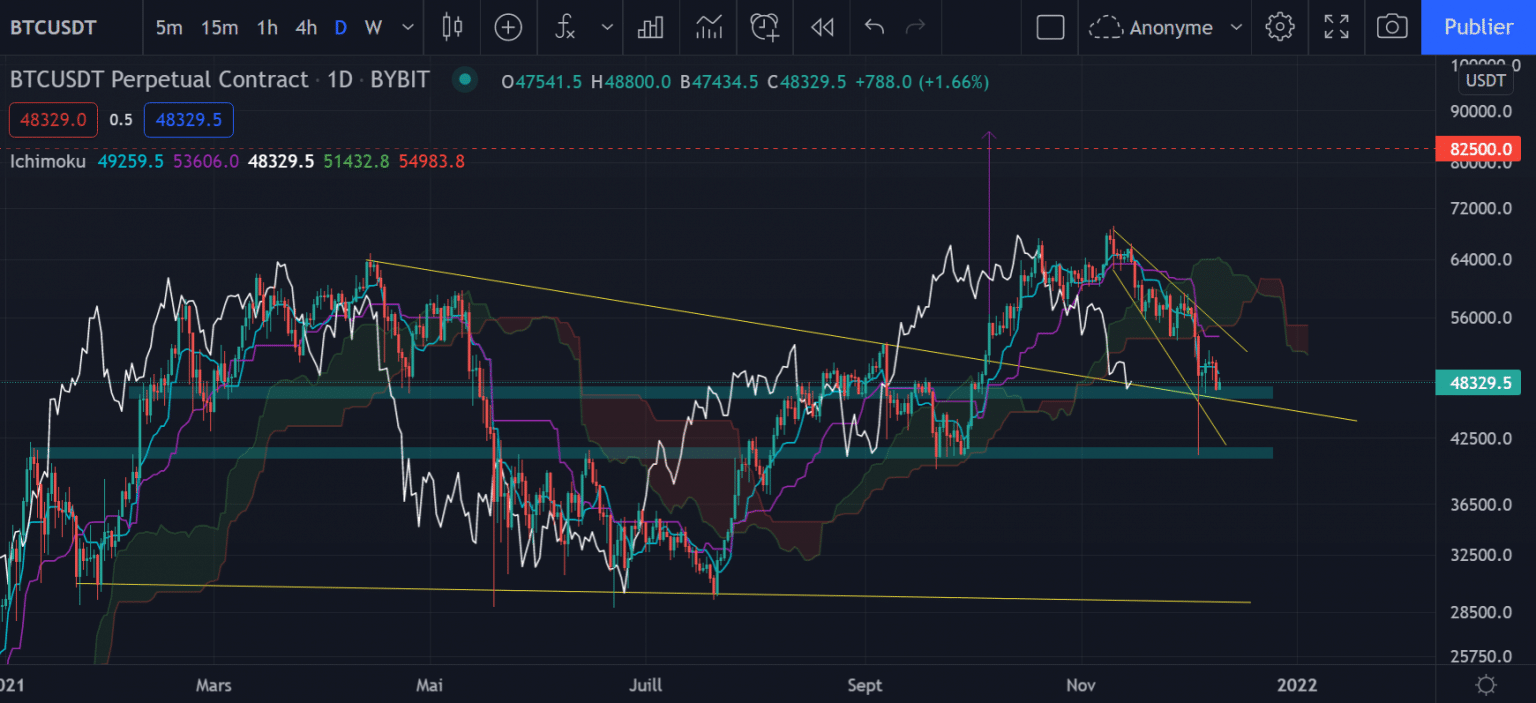
The Bitcoin Daily Chart
As a reminder, the breakout from this very large triangular range had activated a target at $82,500, allowing for a new price high around $69,100. This target remains theoretically valid as long as the pattern is not reintegrated at the close.
BTC will need to bounce off the high trendline, which will provide a perfect pullback before a potential bullish return. As this trendline has been a resistance several times in the past, the possibility of a rebound is to be considered as any resistance becomes support once broken by the price.
Obviously, if this support were to break, we would have to count on a return of the price to the next support, around $41,000 which has been an important resistance on multiple occasions in the past.
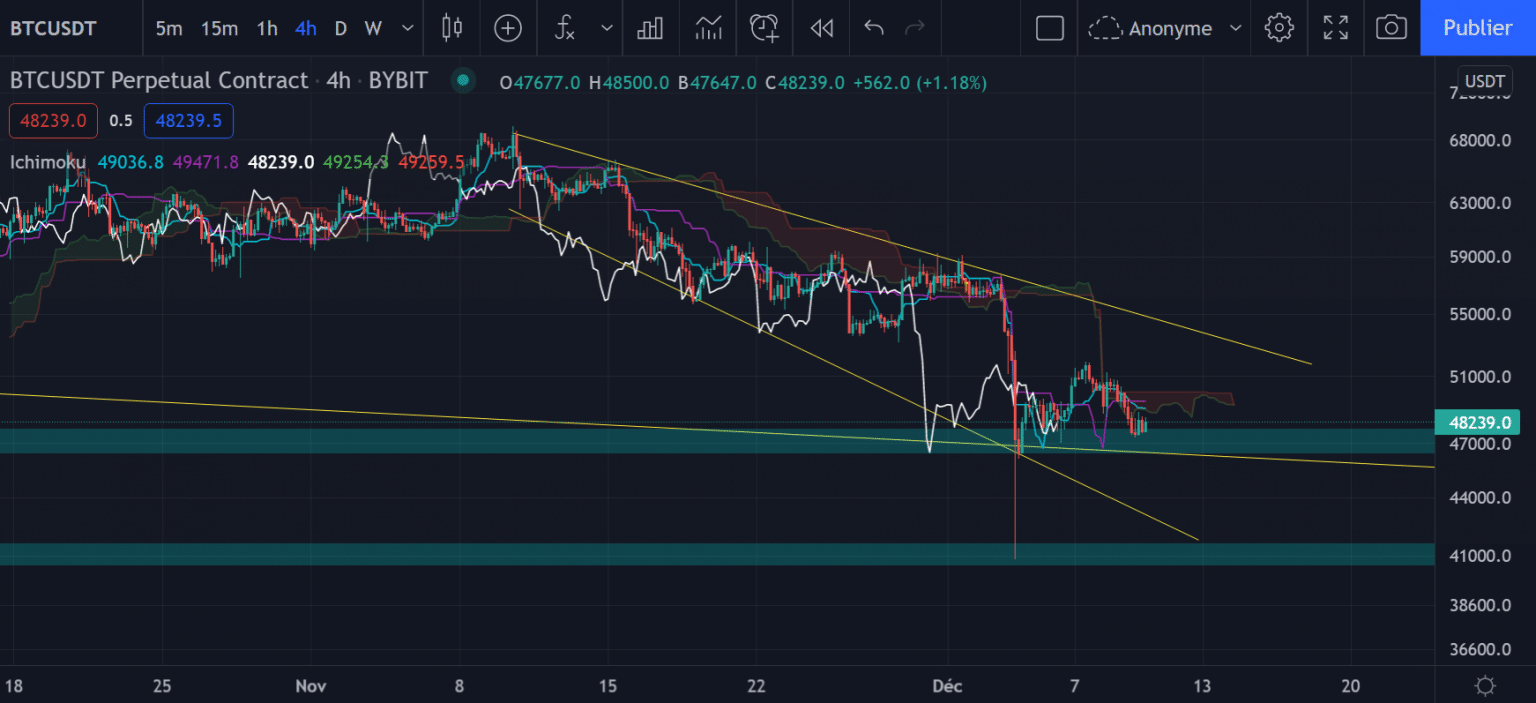
The H4 chart of Bitcoin
In the shorter term on the H4 timeframe, BTC has clearly been in a downtrend since November 8. In order to break this sad dynamic, it will be imperative to break the high trendline (in yellow) in order to make a new market top higher than $59,000. The yellow pattern is a descending wedge, which in general is more likely to be broken from above.
We will therefore be watching for a potential breakout from the top, which would take the price to around $59,000.
If, on the other hand, the first green support area breaks and the market closes with a new candle body lower than the previous one, then there is a good chance that the price will bounce off the next support around $41,000 (also the bottom of the pattern). We are also watching the surgical bounce of the December 4 wick, precisely on this support.
Ether (ETH) can still break out from the top
Like Bitcoin, Ether has been in a bearish range since November 8. Its price is moving within a descending wedge, with the price bouncing from one boundary of the pattern to the other. The question now is in which direction the price will eventually break out of this chartist pattern.
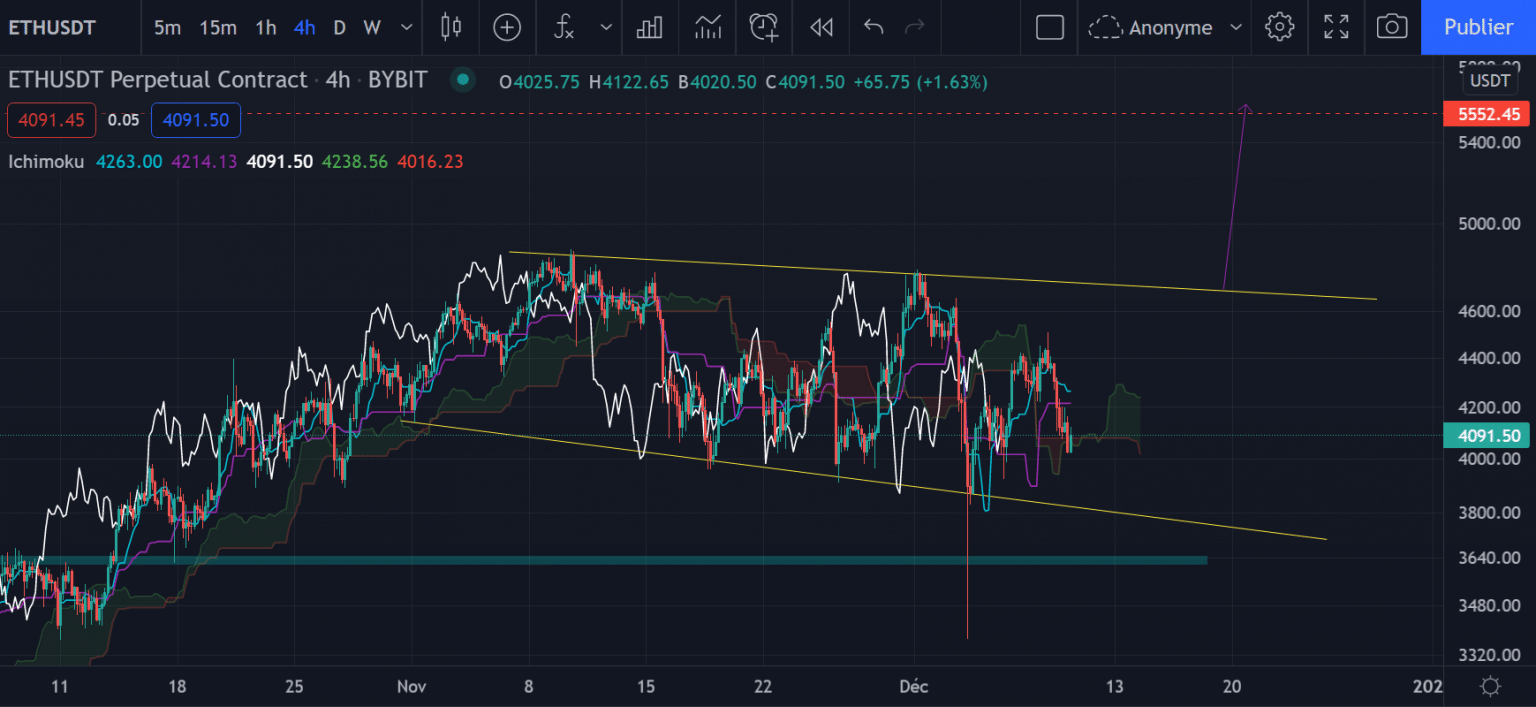
Ether (ETH) chart in H4
ETH is currently testing an important area at $4,000. This support must be held, otherwise the price should return to the bottom of the wedge around $3,800. We can also see that the $3,800, which we mentioned in our previous analysis, has been a defining level as the price has always returned above it on the close so far.
Bouncing off the $4,000 level is still preferable as this corresponds to the daily Tenkan and Kijun. If the price were to regain a bullish momentum, the break of the pattern would lead to a new All Time High around $5,550 (the height of the pattern carried over to where it was broken by the price).
Conversely, if the pattern were to break from below, price would test the next support level at $3,600.
In conclusion
Bitcoin (BTC) and Ether (ETH) are in short-term downtrends, but they can still break out of their chartist patterns from above. Holding the various supports analysed above will be decisive for the continuation of the Bull Run.