
As predicted in our columns, the volatility of the Bitcoin price exploded to the upside at the end of last week, from an all-time chartist low and against the backdrop of a coalition of high-voltage fundamental data. The market returned to the chart support that everyone knows, the $25,000 support level. Should we rush to buy?
The too-perfect technical level of $25,000?
As a chartist analyst of the financial markets, I don’t lock myself into my own market views and, above all, I fight ego with the fiercest energy. A bad chart analyst (I’m not saying I’m a good analyst) is one who has a positioning bias and seeks to reassure himself by finding arguments in the charts, leaving objectivity far behind.
A good way of being as objective as possible when faced with a chart is to start by being open to the opinions of other analysts, or at least to weigh up the pros and cons of their arguments. This is something I do every day with a selection of ‘friendly’ analysts, and I can tell you that EVERYONE thinks that support at $25,000 is too perfect an entry point.
“Too perfect”, because it has been identified by the consensus as the chartist pivot that guarantees BTC’s annual uptrend, and even the entire uptrend that began at the end of last November
In my opinion, and this is already a first mistake, I think that it is still and always the $20/21,000 threshold that plays this role, the eternal ex-ATH.
It is tempting to want to bet on the end of the purge from $25,000, which would validate a wave numbered 2 (the Elliott wave market cycle) in the form of a classic “regular flat”, before the start of a large bullish wave 3.
The difficulty with this scenario is to determine which combination of fundamental data would allow an immediate sharp upward move. To give such a technical signal for a resumption of the uptrend, we would already need to close the bearish gap in the future contract between $27,000 and $27,500, and then break above resistance at $28,660.
In my humble opinion, the resumption of the uptrend will take more time and the market could work the $21,000/25,000 area before recovering, if not spend more time solidifying the $25,000 support.
There are many technical hypotheses, and below I offer a summary in the form of 2 charts, and I invite you to watch my latest “TCN Technical Briefing” video to find out more.
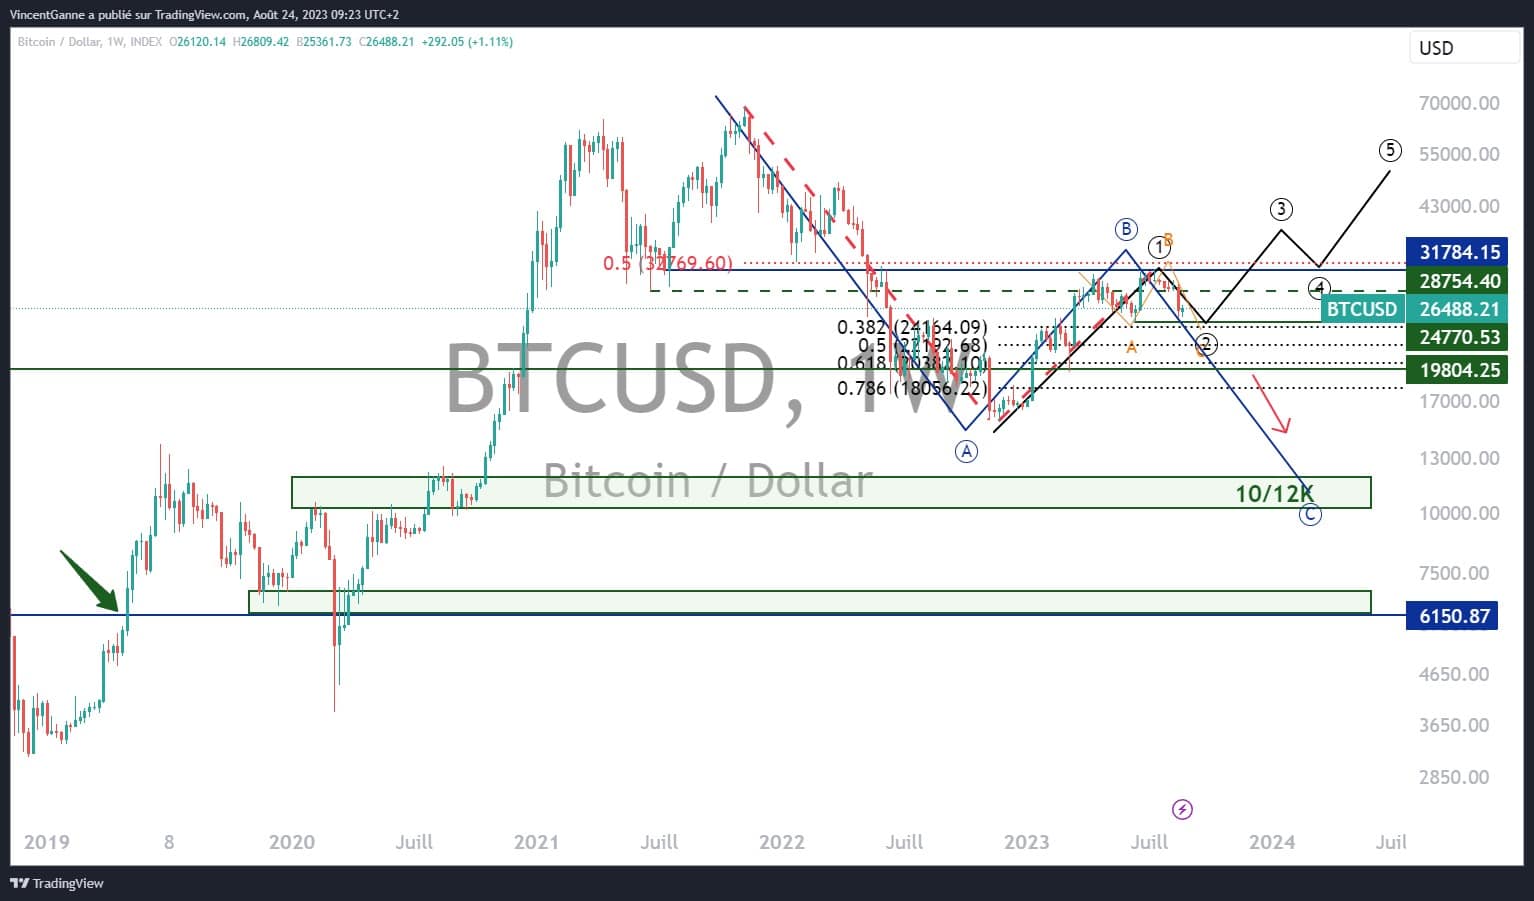
Chart showing Japanese candlesticks in weekly data and with an arithmetic scale for the bitcoin price (BTC/USD)
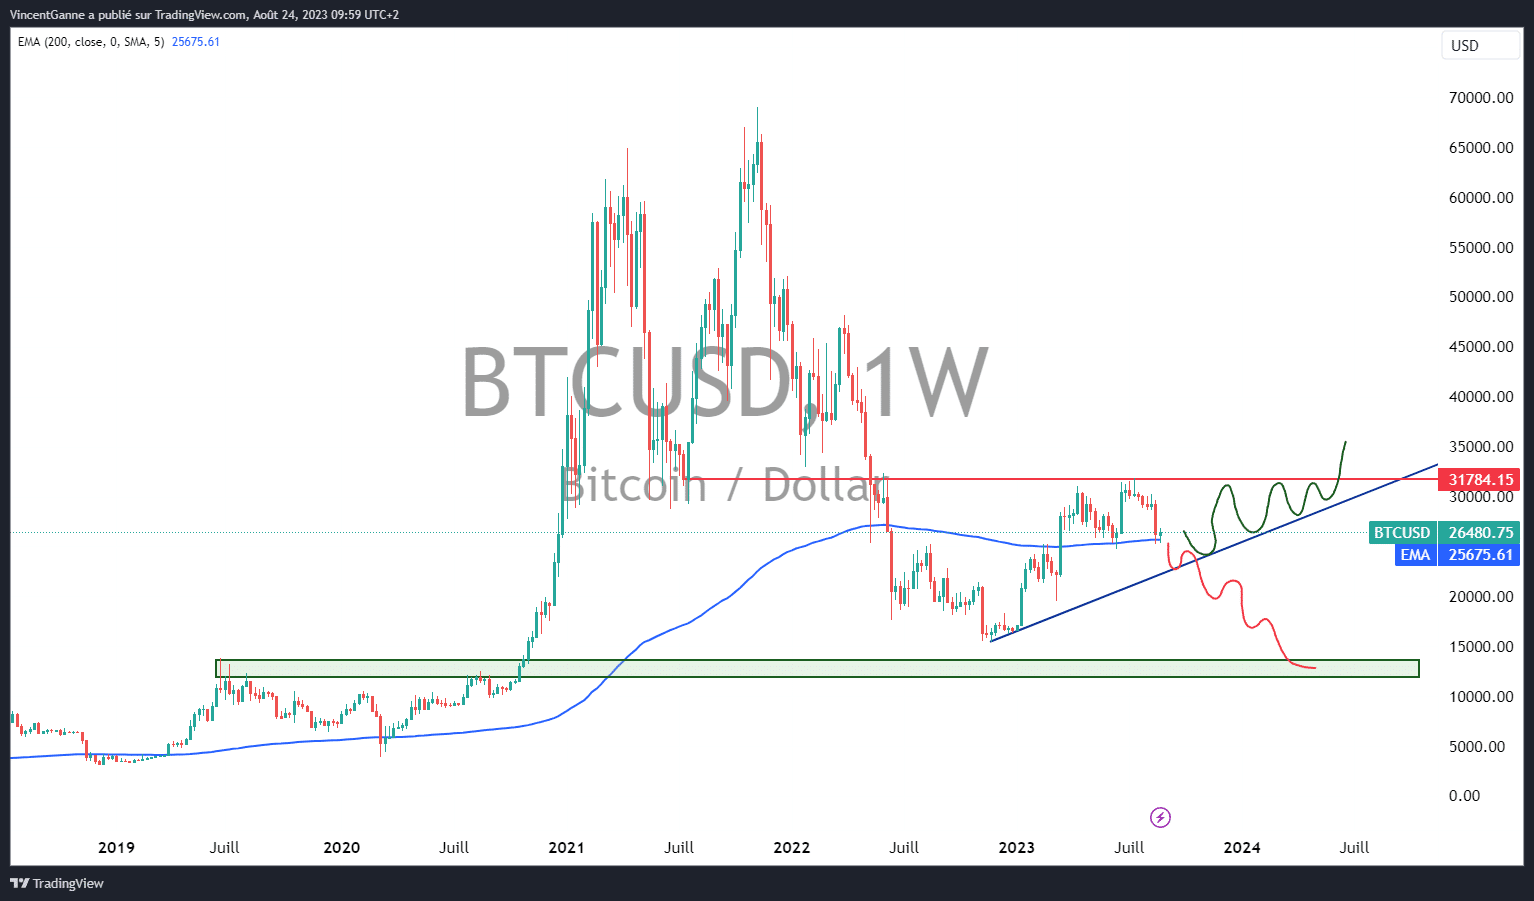
Chart showing weekly Japanese candlesticks with arithmetic scale for the bitcoin price (BTC/USD)
On the technical front, US tech stars are holding their own
The debate over which support will kick-start the rise in the price of BTC can be addressed by turning, as usual, to the major inter-market correlations acting on the Bitcoin price. The positive correlation with the trend of US tech stars on the equity market is a fact, even if some Nasdaq stocks have done much better than BTC, Nvidia in particular springs to mind.
Below is a chart of the broad index, the Nasdaq Composite, which is fairly close to BTC in its recovery, and you can see that it too is on support.
So, $25,000 or not $25,000? It’s up to you to decide.
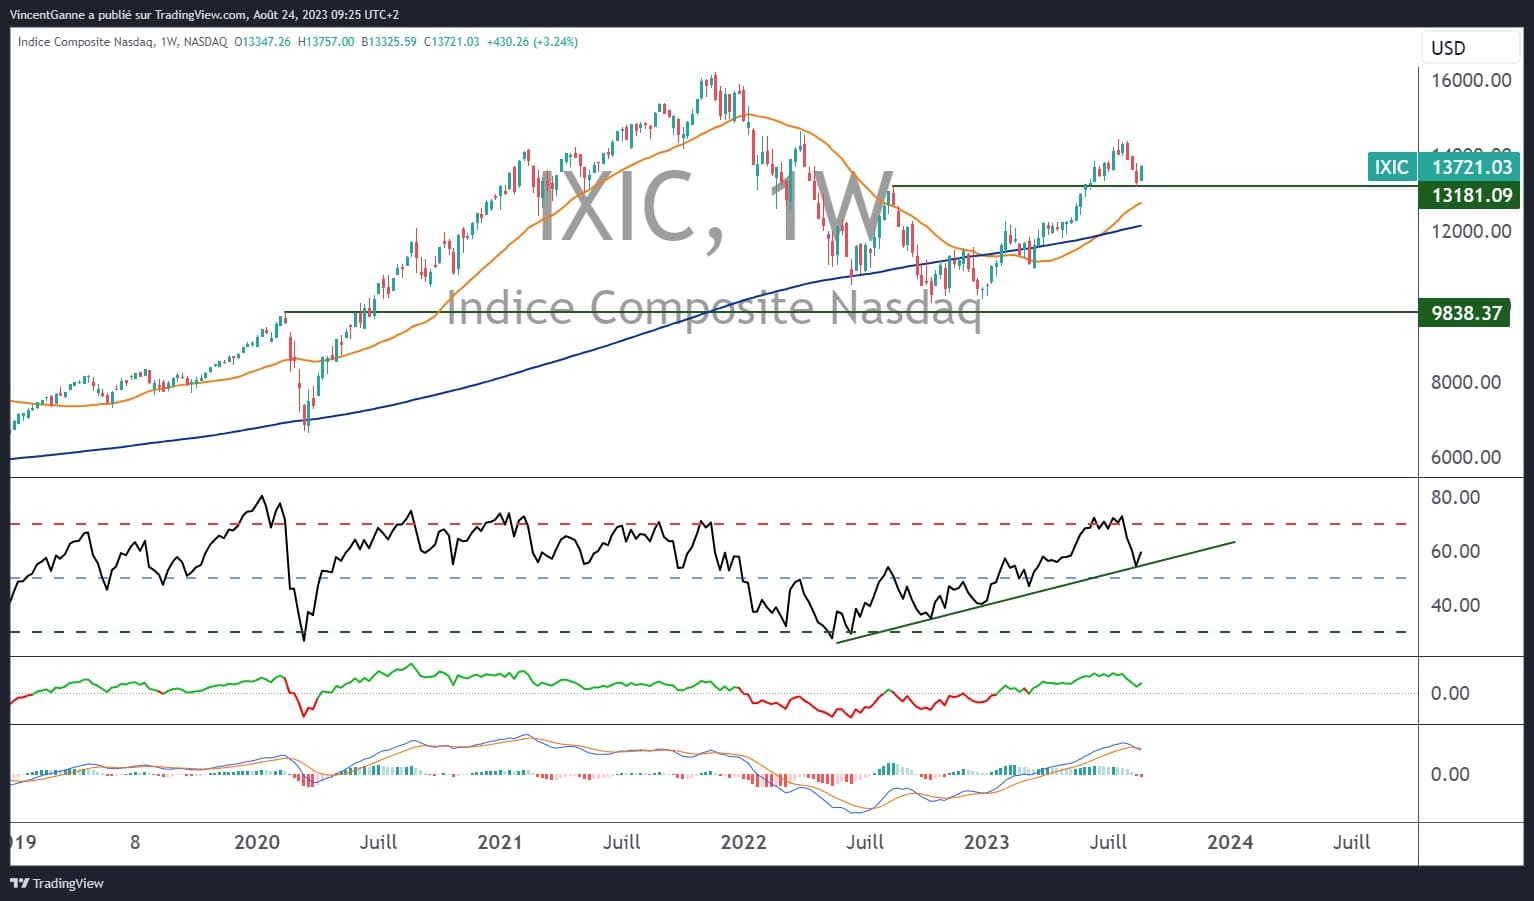
Chart showing weekly Japanese candlesticks on the Nasdaq Composite index