
With the number of active addresses and on-chain transactions up notably, the long-term adoption of Bitcoin (BTC) is real and visible. A fundamental usage floor seems to be building since the end of the 2014 – 2015 bear cycle. On-chain analysis of the situation
Bitcoin is testing the patience of participants
Once again, the Bitcoin (BTC) price hits a record low volatility, leaving the new year to begin with uncertainty about the short-term trajectory of the price.
While the $16,000 level has held up for now, the former $18,000 support is now acting as resistance to the price’s rise.
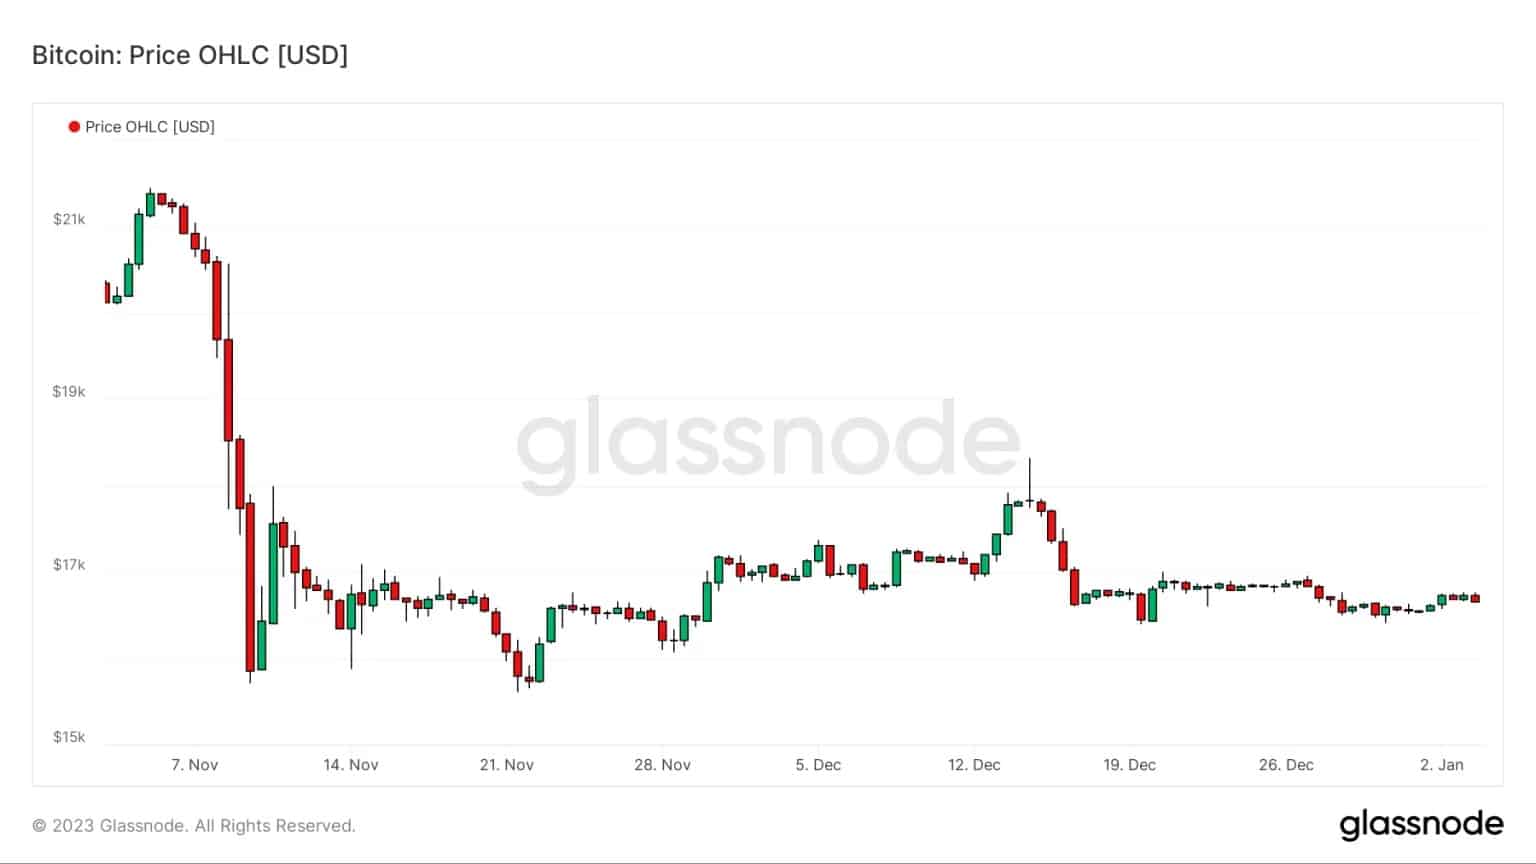
Figure 1: Daily BTC price
After a 2022 dominated by selling pressure, the current stagnation in BTC bodes well for a new low, which could signal the cyclical bottom that so many investors have been waiting for.
Today, we will observe the state of the network’s block space demand (on-chain activity), which is evolving increasingly through the cycles and provides a clear signal of Bitcoin network adoption.
Slow, but palpable adoption
The demand for block space, commonly referred to as “on-chain activity”, measured through various metrics, observes the state of transactional demand on the Bitcoin network, as well as its congestion.
The study of this metric provides a gauge of the degree of use and adoption of the network over market cycles, making it possible to characterise the overall behaviour of participants over a given period of time.
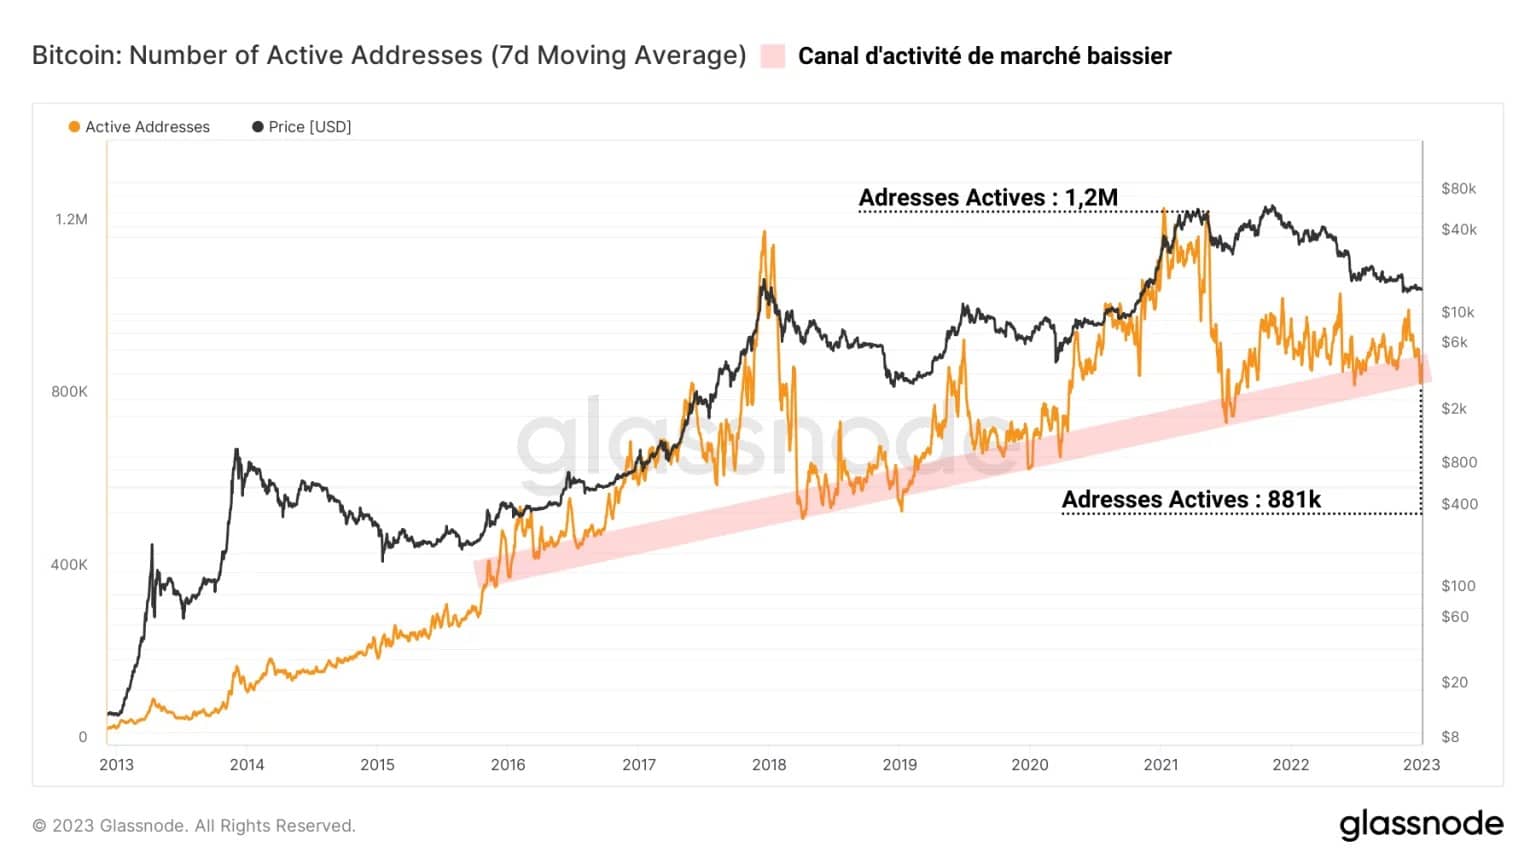
Figure 2: Active Bitcoin addresses
From a long-term perspective, a fundamental usage floor (in red) appears to be building since the end of the 2014 – 2015 bear cycle.
Currently, activity on the network is returning to values coinciding with this ascending channel, also reached during the May 2021 sell-off, and amounts to nearly 880,000 active addresses per day.
This observation is also visible via the measurement of the number of adjusted transactions per entity. Evolving in a bearish regime since mid-2021, the metric is now around 212,000 daily transactions.
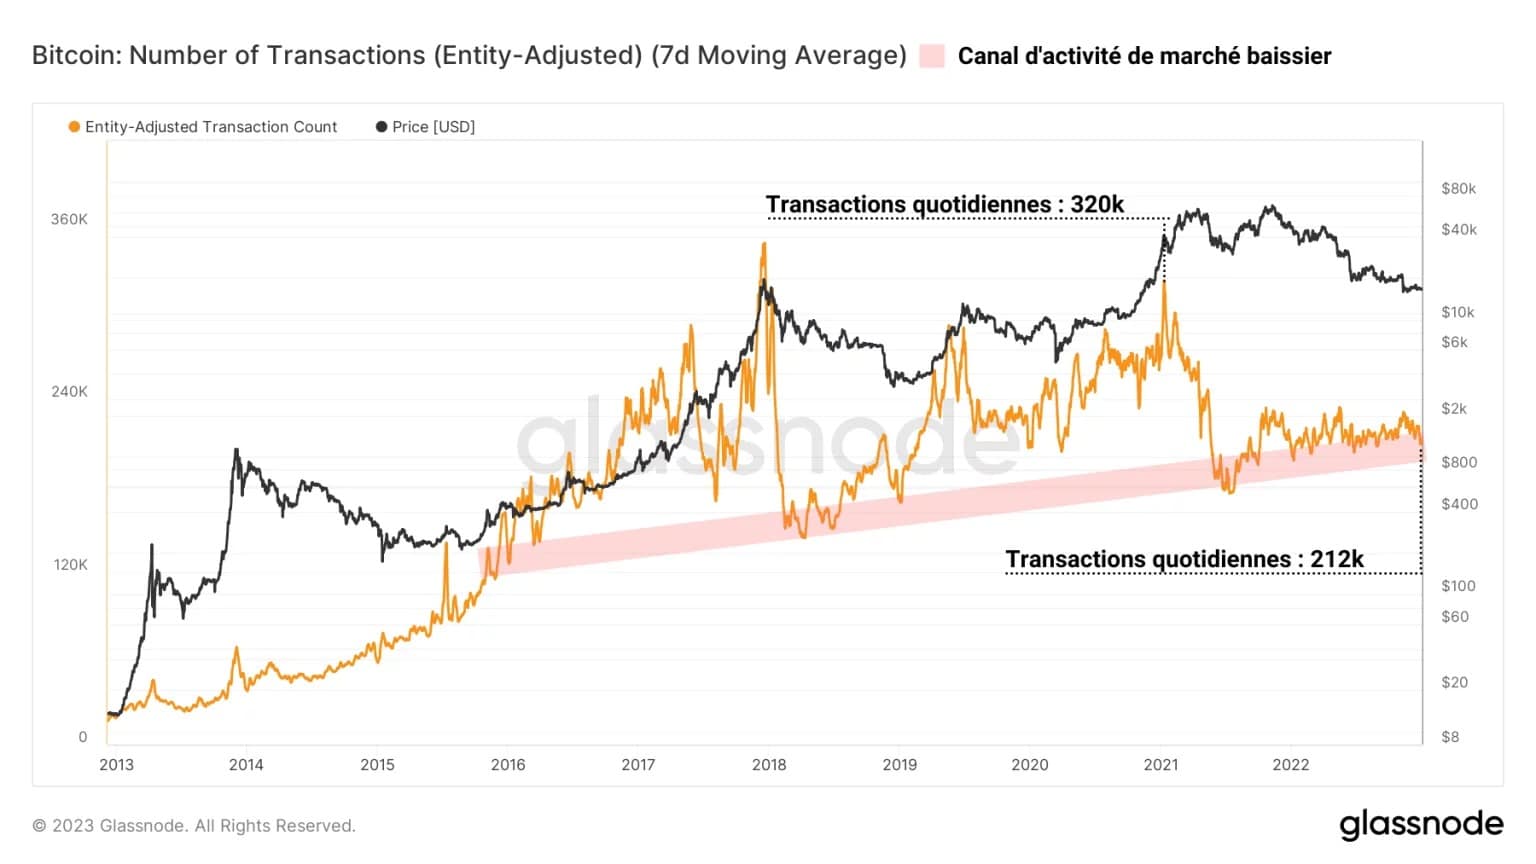
Figure 3: Daily Bitcoin transactions
This decrease of almost a third in transactional demand over the past few months marks the lack of participant interest in on-chain transactional settlement during long-term market declines.
However, over the long term, the number of on-chain transactions is visibly increasing, with extensions above the fundamental activity channel during bull markets and returns to the “normal” (long-term user base) during bear markets.
In the short term, despite a fall in the rate of completed trades since the FTX collapse, the number of pending trades in the mempool indicates a palpable increase in demand for block space.
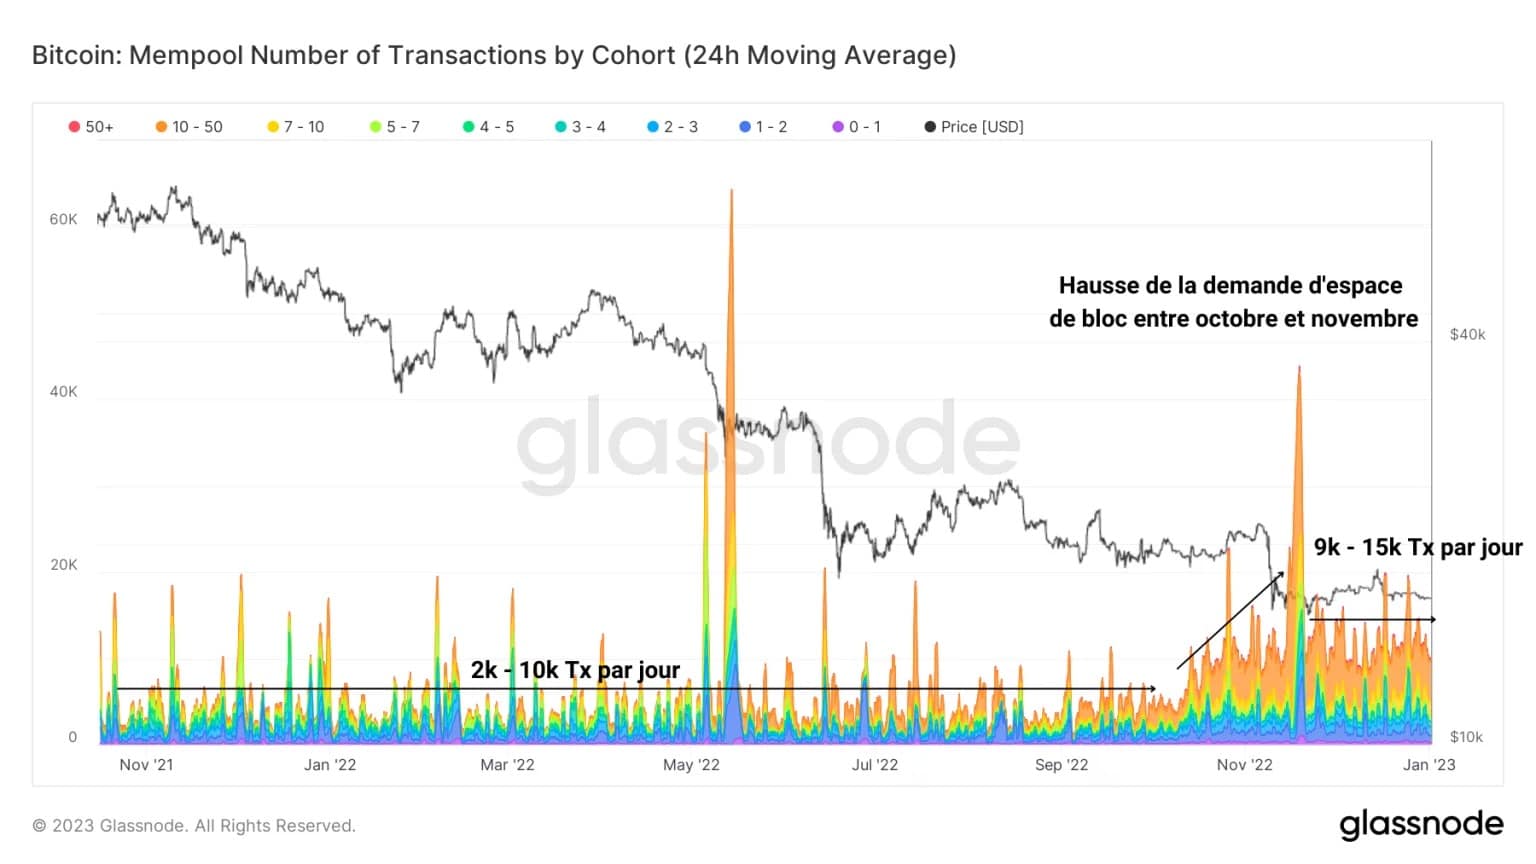
Figure 4: Bitcoin transactions in the mempool
From a range of 2,000 – 10,000 pending transactions to 9,000 – 15,000 pending transactions since the October-November period, the following graph indicates that many participants are eager to see their transaction completed.
Thus, following the late November peak, activity levels have declined, but remain higher than before the FTX collapse, signalling a slight overall increase in participant interest.
Finally, we can observe a parallel dynamic via the measurement of transaction fees paid to centralized exchanges (CEX) by their users.
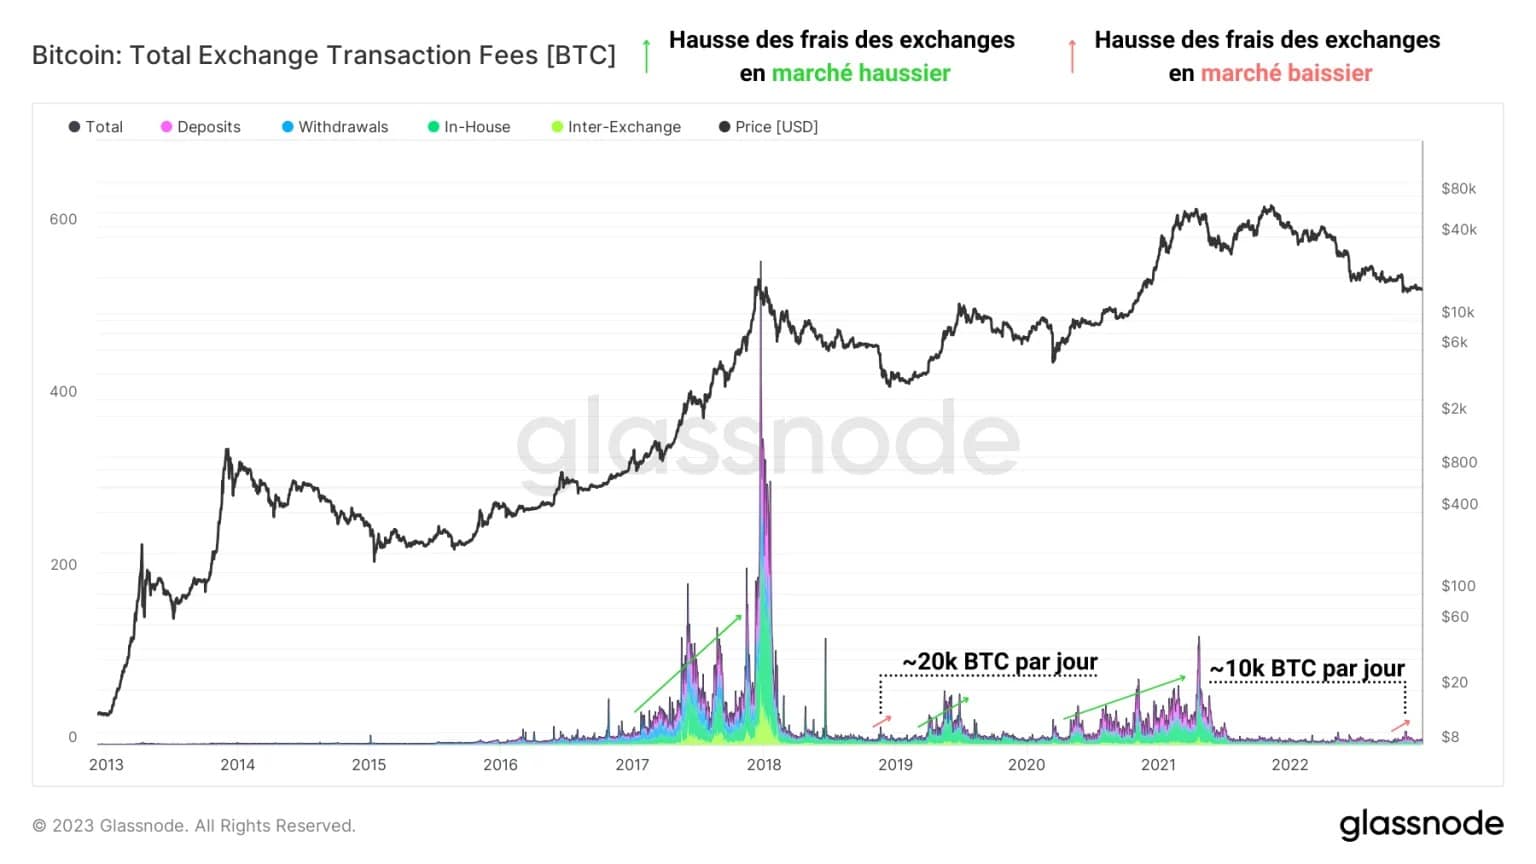
Figure 5: Fees paid to centralized exchanges
Although the total daily fees are decreasing over time – notably due to the expansion of DeFi – we can observe noticeable increases in fees:
- During bull markets (green), as new entrants flood the CEX with liquidity;
- Near the lows of bear markets (red), when the least resilient hands capitulate and pay top dollar to sell their holdings as quickly as possible.
In November 2022, we thus witnessed a similar increase in fees paid to CEXs as in the November 2018 capitulation, although the magnitude was halved.
Summary of this on-chain analysis of BTC
In sum, this week’s data tells us that the long-term adoption of Bitcoin is real and visible through the measurement of on-chain network activity.
In the long term, the number of active addresses and the total number of transactions made daily show a notable increase, meaning that the number of users is growing gradually over the cycles.
In the short term, the number of pending trades in the mempool indicates a slight increase in participant interest following the collapse of FTX and the break of the $18,000 support level.